Abstract
The African continent is made of young developing countries and is full of unexploited resources and unexplored richness. This thus provides a ground for development and growth. In an absence of financial resources and historical power, education is the best tool for a socio-economical revolution, especially when we consider that this continent has a demographically young population.
As a further endeavor, using machine learning tools, we came up with a new socio-economic index quantifying the effectiveness and importance of a country's efforts in developing education.
Indicators
Based on analysis of the dataset, the most compelling indicators were extracted
Education indicators
- Male/Female school life expectancy:
School life expectancy is defined as the total number of years of schooling which a male/female child of a certain age can expect to receive in the future. - Gross/Net enrollment ratio in primary/secondary/tertiary education :
- Pupil-teacher ratio in primary/secondary education :
Primary/Secondary school pupil-teacher ratio is the number of pupils enrolled in primary/secondary school divided by the number of primary/secondary school teachers. - Percentage of GNI spent on education :
Public spending on education includes direct expenditure on educational institutions as well as educational-related public subsidies given to households and administered by educational institutions.
Social and economic indicators
- Human Development Index (HDI):
The HDI is based on the following three indicators: longevity, as measured by life expectancy at birth; educational attainment, as measured by a combination of adult literacy (two-thirds weight) and combined primary, secondary and tertiary enrollment ratios (one-third weight); and standard of living, as measured by real GDP per capita (PPP $). - GNI per capita :
GNI per capita (formerly GNP per capita) is the gross national income, converted to U.S. dollars, divided by the population. At current prices in US$. - Employment-to-population ratio :
The employment-to-population ratio is equal to the number of persons employed divided by the working-age population and multiplied by 100. - Percentage of women participation in workforce:
Economically active female population is equal to the number of economically active women divided by the economically active population and multiplied by 100. - Life expectancy at birth:
Life expectancy at birth is the average number of years a newborn is expected to live provided that mortality patterns at the time of its birth remain constant in the future.
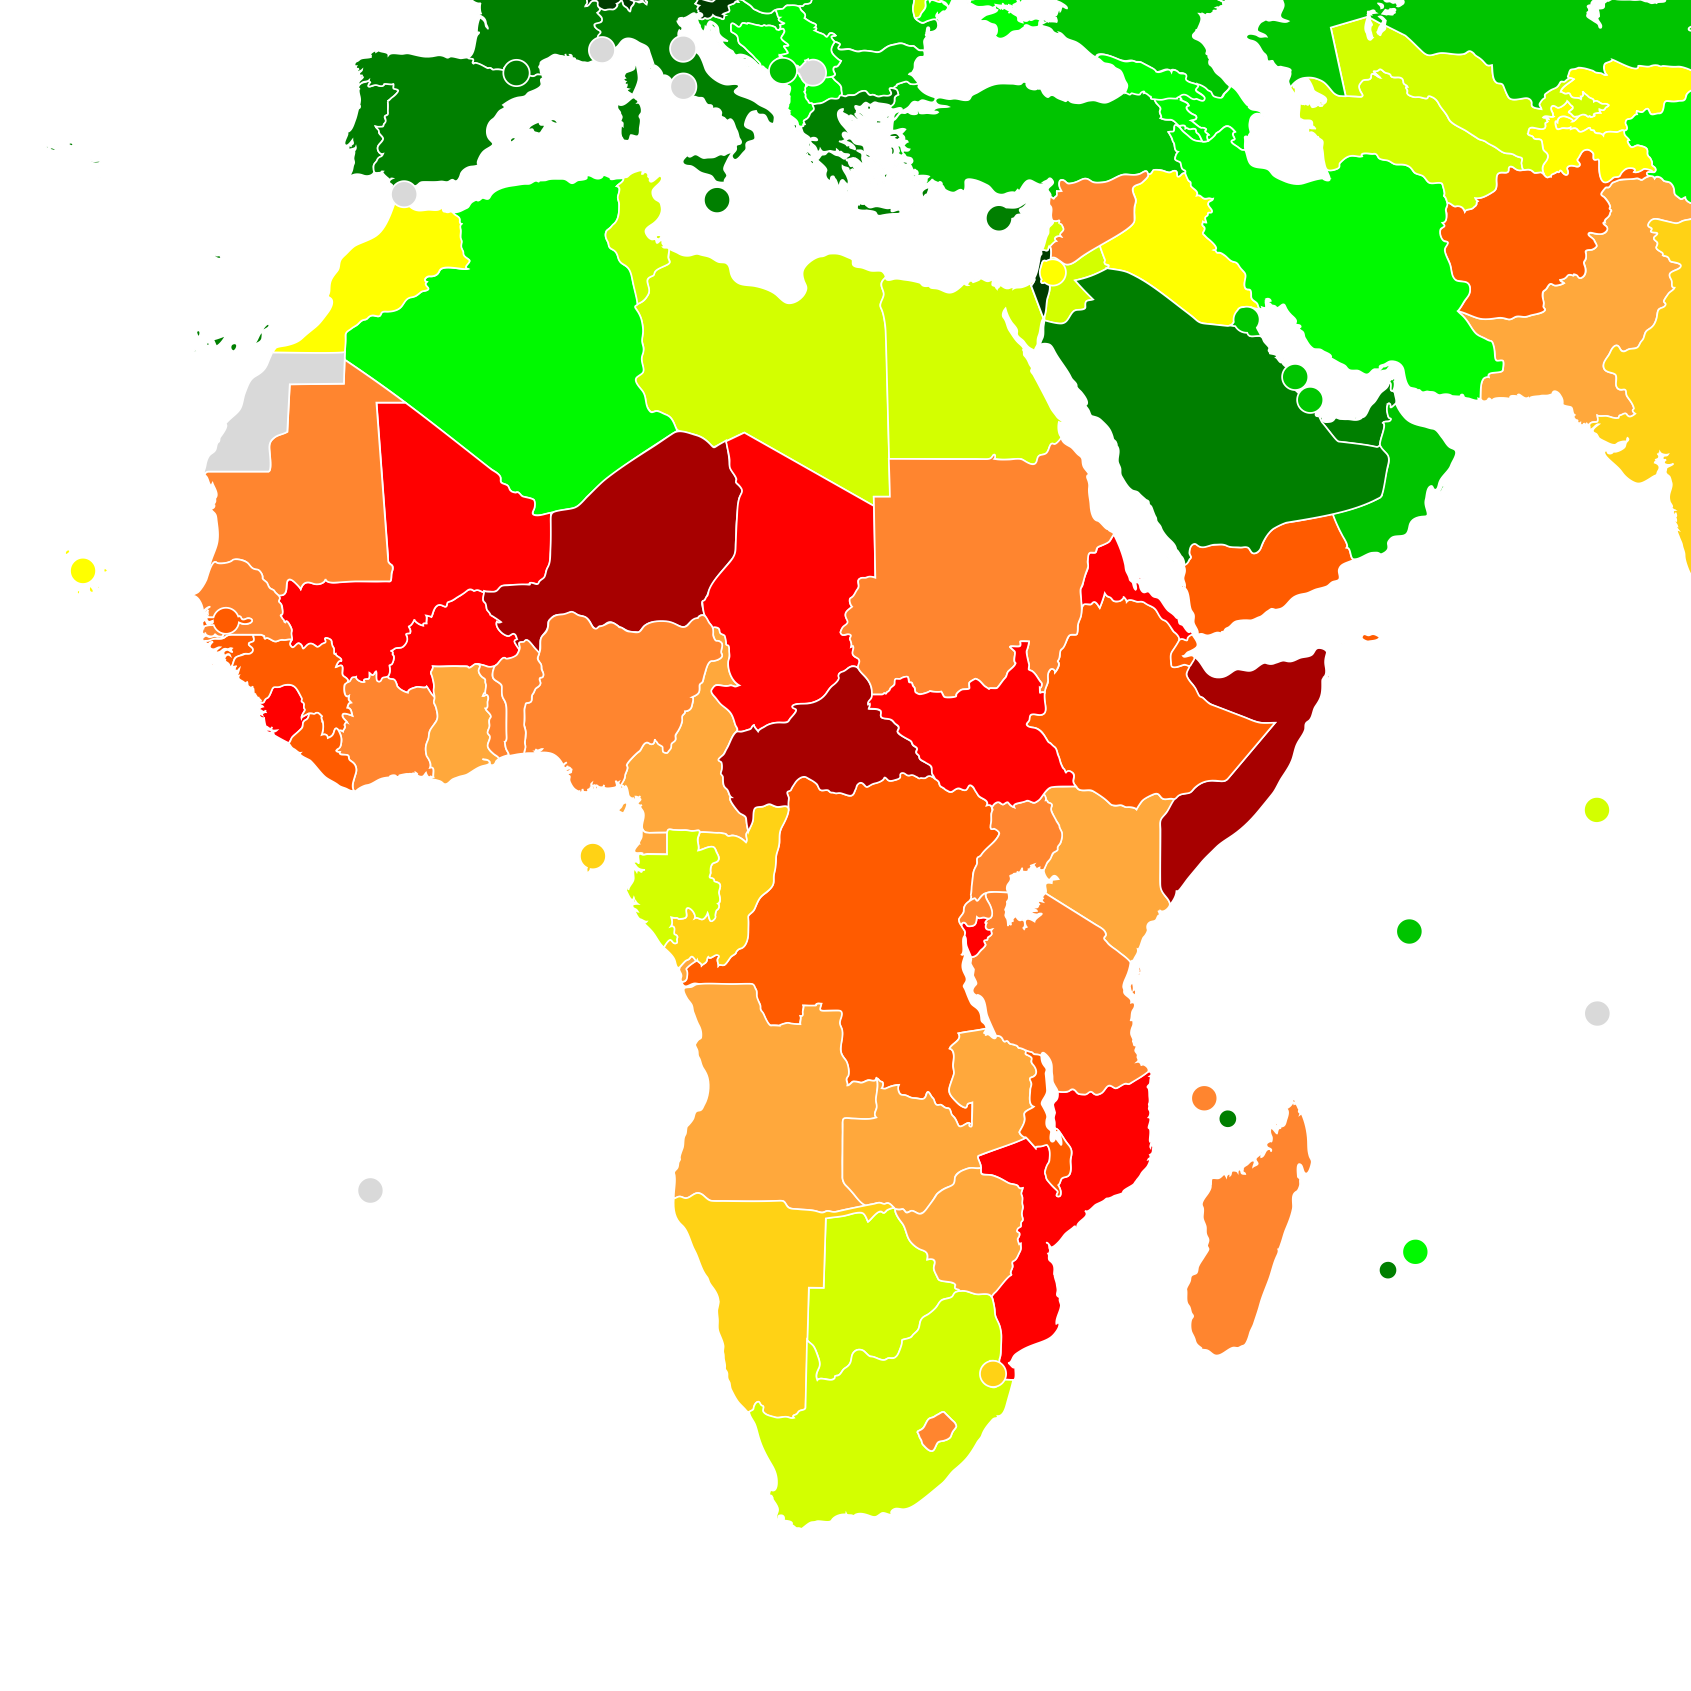
Distribution of wealth in Africa (GDP in USD), most recently-recorded values
Fast growing economies:
Countries achieving considerably high GDP growth rate, reaching values higher than 6% for more than 10 countries in the latest recorded values. The average growth rate from 2007 to 2016 of the african countries is 1.7%. Ethiopia leads the list with 8.5% GDP growth rate.
World average in 2019 is 3.01%(source= https://www.statista.com/statistics/273951/growth-of-the-global-gross-domestic-product-gdp/)
In 2015, out of the top 10 fastest growing countries in the world, 5 of them were African.
Stories
Some are successful, some aren't. Discover.
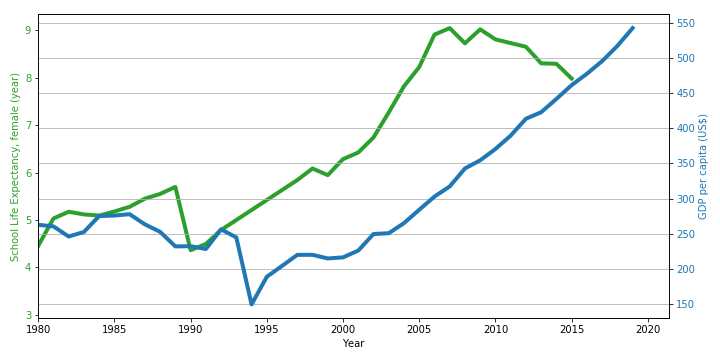
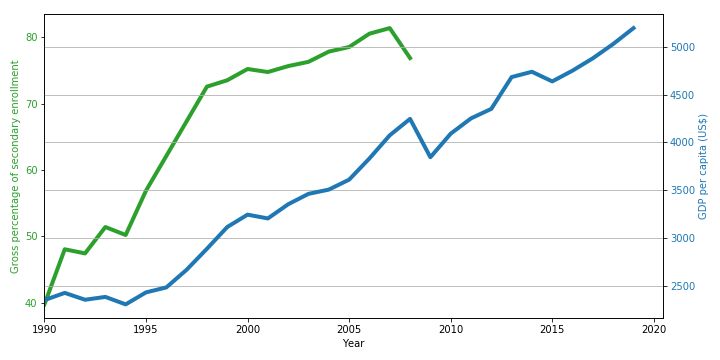
Ethiopia
Education produces growth
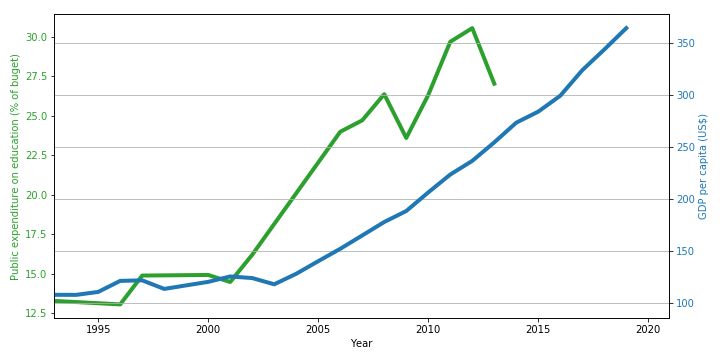
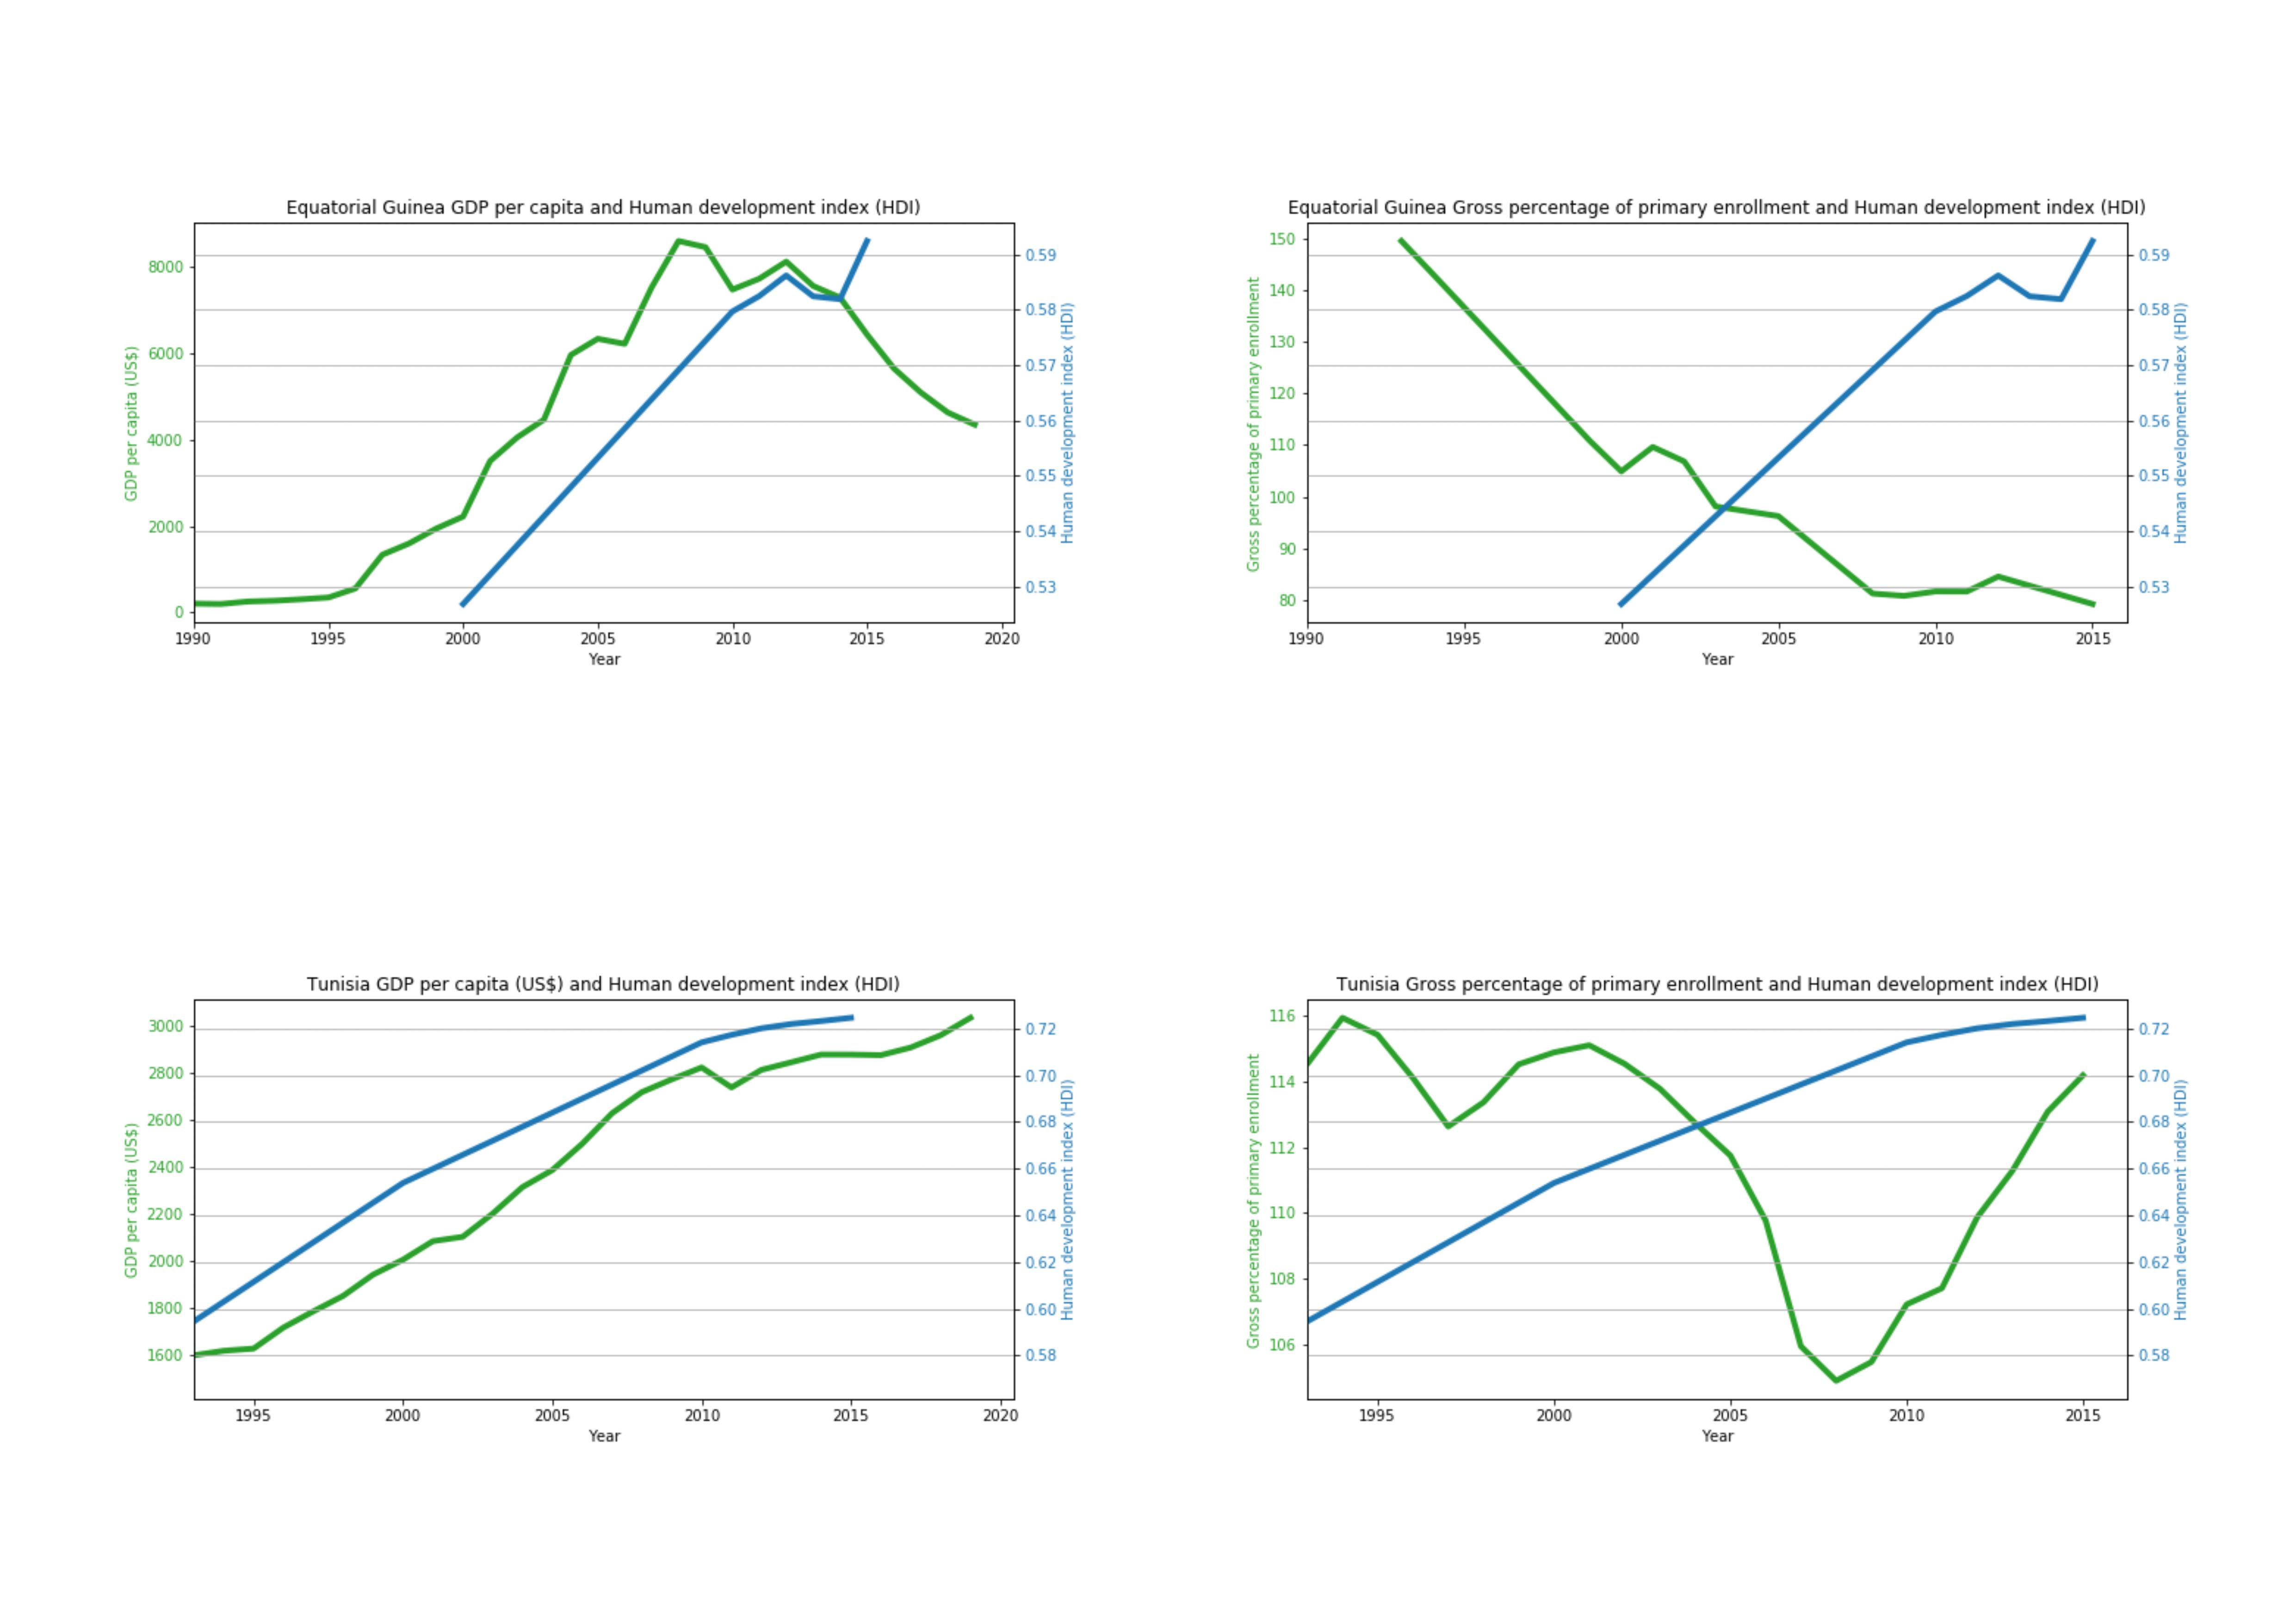
Education in dictatorships
Equatorial Guinea vs Tunisia
Rwanda
A country reborn

Botswana
When drought and pandemics aren't enough.
Conclusion
In conclusion, investing in education is certainely a necessity for the socio-economic development however it's not enough. In fact, more requirments need to be met in order to fulfill a sustainble development. For example job opportunities should be available for graduated student. The rule of law is also fundamental as it offers equality of chances for different social classes / genders etc ..
The Education & Development Index (EDI)
An index inspired by the way the Human Development Index (HDI) is computed, linking education and development
-

A novel way of quantifying education
How?
Nowadays, all indicators are calculated by weights set from previous knowledge of the general trend and ranges of values in the related field. For example, the life expectancy index is calculated as the measured life expectancy value minus 20 and divided by 65, meaning that it would take a value of 0 if the life expectancy value of a country is 20 and 1 if a life expectancy value is 85. This comes from previous knowledge about the life expectancy values all around the world.
Arbitrarily setting the weights of a said indicator, which goal is to quantify a certain aspect of social and economic development takes a considerable amount of effort, trying to study all the details of the fields related to that indicator. In addition to this, the weights of the indicators have to be constantly changed to adapt with the temporal changes across countries.
For this reason, we tried to find a way to create our own index, using Machine Learning tools to optimize the selection of weights. The higher the value of the index will be, the better the overall performance in education of a country is. -
The Human Development Index (HDI)
Used by the United Nations Development Programme to measure a country's development.
The HDI ranges from 0 to 1 and increases with a country's development. It is calculated from the combination of three axes:
Health, quantified by life expectancy at birth
Income, quantified by the GNI per capita
Education, quantified by literacy rate (pre 2010) or average and expected years of schooling (post 2010) -

The Human Development Index (HDI)
Where it fails
It is true that the HDI will be higher for a developed country, as in general high income, long lifespan and better education are found in them. However, the HDI gives a narrow representation of a country's development. In fact, it fails to represent several key aspects of social development.
A high income per person does not necessarily mean that the people are rich. For example, a country can have a high income per person but a poor population will rank higher than a country with lower income per person but with more equal wealth distribution.
Also, HDI does not indicate how much a country succeeds in ensuring equality among its population, most importantly between genders. -

The Education & Development Index (EDI)
Predicting development with education using Machine Learning
Using the data we have, we tried creating an index that predicts the development of countries based on a weighted sum of the education indicators cited previously. The value range of the index is the same as that of HDI, i.e. ranging from 0 to 1 and increasing with a country's development.
A machine learning regression model was trained in order to find the weights that predict development the best. But first, we had to define development. -

The Education & Development Index (EDI)
Defining development
After analysis of the available indicator values in our dataset as well as their meaningfullness, we extracted a selection of 4 indicators in an effort to obtain a vision broader than that of HDI, considering gender equality and employment rate. The new index is the geomtric mean of four indexes, each one scaled from 0 to 1 and representing a major axis of development:
Employment : Employment to population ratio
Health : life expectancy at birth (0 is 20 and 1 is 85)
Income : GNI per capita logarithmically scaled (0 is 100 and 1 is 7500)
Gender Equality: Women's Share of Total Labor Force (0 is 0 or 100 and 1 is 50) -

The Education & Development Index (EDI)
Training the dataset
A ridge regession model was trained with the EDI as a target value. The EDI was computed first using the previously defined method (geometric mean of the four axes: employment, health, income and gender equality). Then a series of education-related indicators (enrollment ratios, male/female school life expectency, public expenditure on education). After an optimization with generalized cross-validation, the model output a set of weights that map the education indicators (education space) to an EDI value (development space).
After computing the EDI with the development indicators, we see that some of our educational indicators correlate well with it, especially the secondary enrollment percentage with a value of 0.61. Two indicators have a negative correlation as they correspond to the pupil-teacher ratios. The higher the students are compared to the number of teachers, the less the EDI value is.
The results
About the significance of the EDI indicator: Looking at the predicted values map, we think our indicator did a pretty good job in general and matched quite well our expectations for a mojority of the countries, but also did bad for some others,with relative errors higher than 10% , like Ivory Coast, Ethiopia and Democratic Republic of the Congo after a deeper research and with comparison to the United Nation's Educational index..
We see that apart from 4 or 5 countries the relative error was really low, with values less than 5% for most of the predictions, between the predicted and actual values for our indicator, even though our model was trained on a small amount of data (number of countries where data is available, for most recent year which ended up in a total of 536 available datapoints).
This is quite satisfactory, hoping that with more data our model will be better fit and hence can make better predictions.
Comparing HDI with EDI
We can directly see from the values throughout the 25 years that the African continent is in a slow but constant development from both HDI and EDI indexes.
We can also see that the Human Development Index and the Education Development Index are well correlated.
Both observations were expected, as the continent should be developing in time and not going backwards, also the EDI is expected to be correlated with the HDI as they are both Development indexes and generally education is a garanteed source of growth.
Our Amazing Team

Amir Ghali
Data Science

Aymen Bahroun
Robotics

Mahmoud Sellami
Data Science

Salim Ben Ghorbel
Robotics